A Study on Cleveland's Population Density
Cleveland’s Declining Population Density
During the first half of the Twentieth Century, Cleveland was one of the largest cities in the country, boasting a relatively dense pattern of urban development. Compared to many of the older, East Coast cities in the United States, Cleveland has a significantly lower population density. While Cleveland is better in this regard than many of the Sunbelt cities, there is a lot of repopulation work to be done to help make the city more vibrant, as well as to support the expansion of public services using increased municipal tax revenues.
As of the 2020 Census, the population density in Cleveland was 4,796/sq mile. This is a rather low number compared to that of 1950, the year when Cleveland reached its peak population; in that year, the population density of the city was 11,760/sq mile. This historical population density is comparable to many other cities today, including Philadelphia (11,600), Chicago (12,000), and Washington (11,300). Cleveland and these other three cities all peaked in population as of the 1950 Census and were also all in the top ten largest cities in the country at the time.
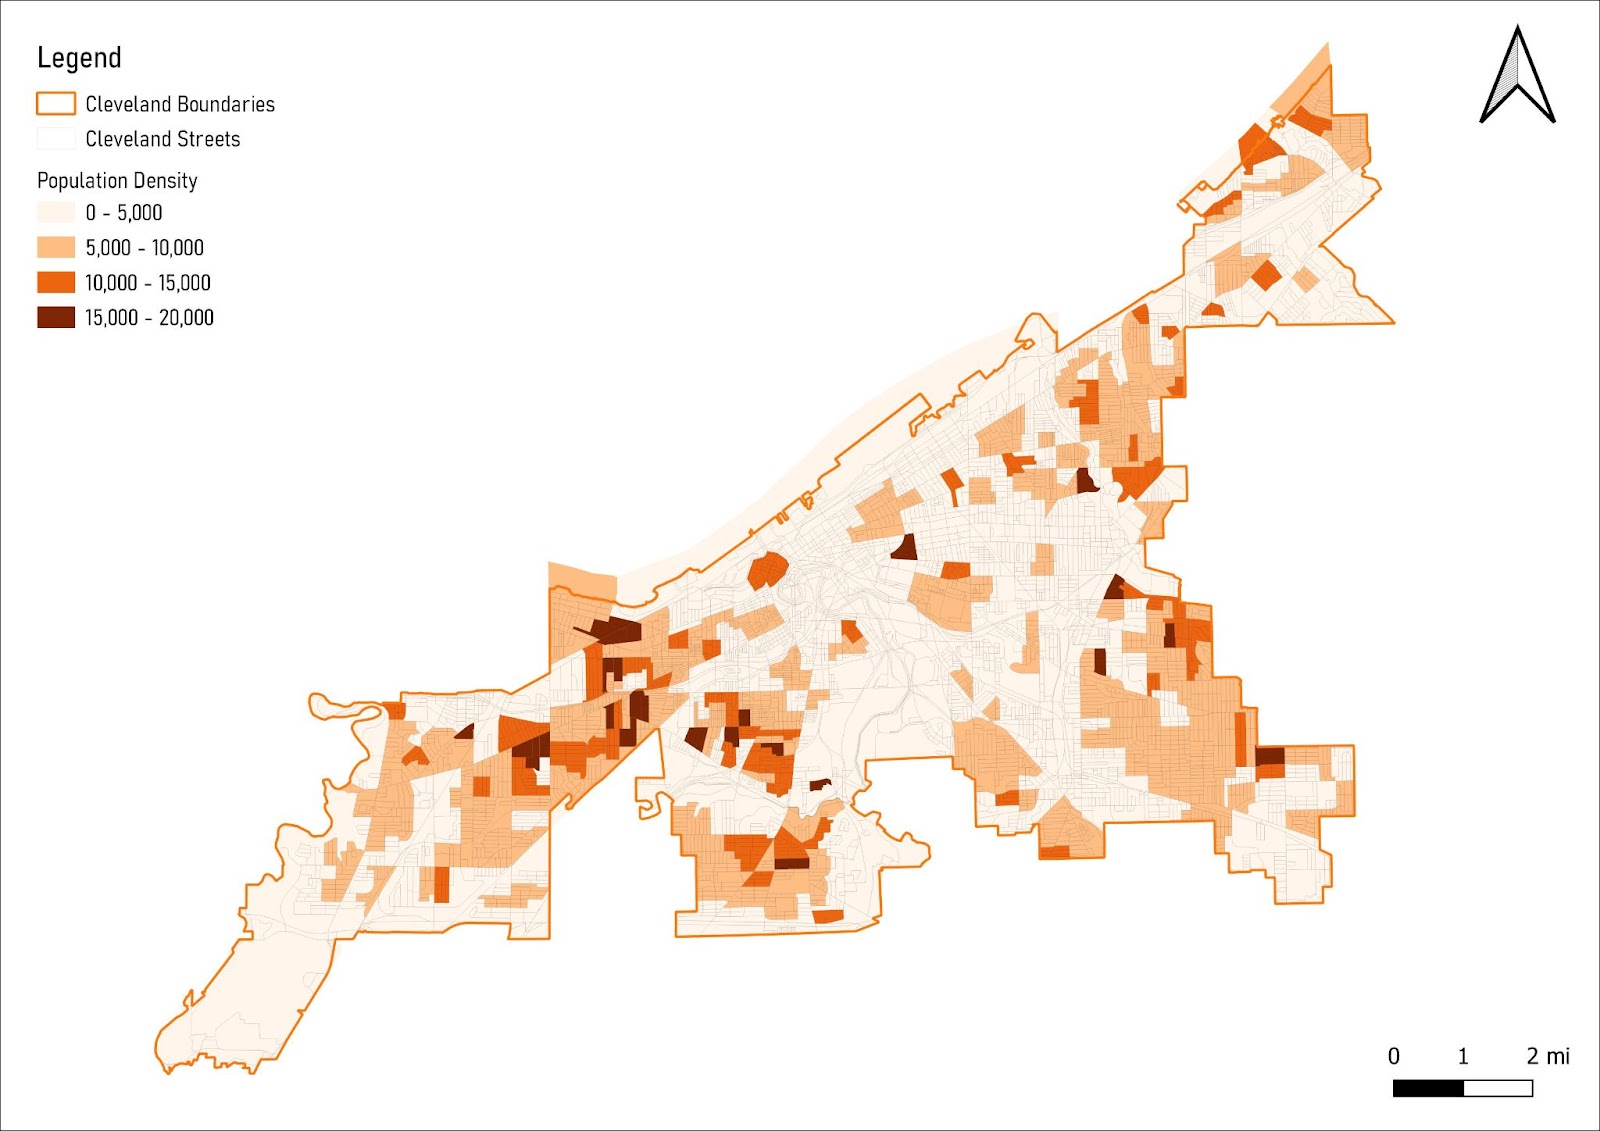
Population data for Census Block Groups in 2019 show that most parts of Cleveland have a density under 10,000/sq mile, while there are small pockets with higher densities. Only areas of the two darker shades have a density that is traditionally considered to support urban walkability. Source: US EPA
Of course, there are parts of Cleveland that are denser than others. Generally, there are parts of both Cleveland and Cuyahoga County that reach the widely-accepted threshold of 10,000/sq mile to support walkability. As shown in the map above, there are many pockets of higher population densities, especially on the West Side. The relative lack of population density on the East Side is clearly a legacy of redlining, which eviscerated predominantly black neighborhoods through government-sanctioned housing discrimination practices. What is also notable from this map is that many of the most in-demand neighborhoods today, such as Ohio City, Tremont, and Downtown, have relatively low population densities. This has contributed to the skyrocketing prices in these neighborhoods over the last decade - there simply is not enough housing supply in these areas.
Understanding the Higher-Density Areas
One fascinating finding that came from the US EPA block group data is that the denser parts of Cleveland contain a significant proportion of the city’s population. In fact, approximately 265,000 residents, or 71% of the city’s total population, live in just 38% of the land area. The mean population density of these areas is approximately 9,000/sq mile, which is much closer to the type of walkable, urban density that we want to see.
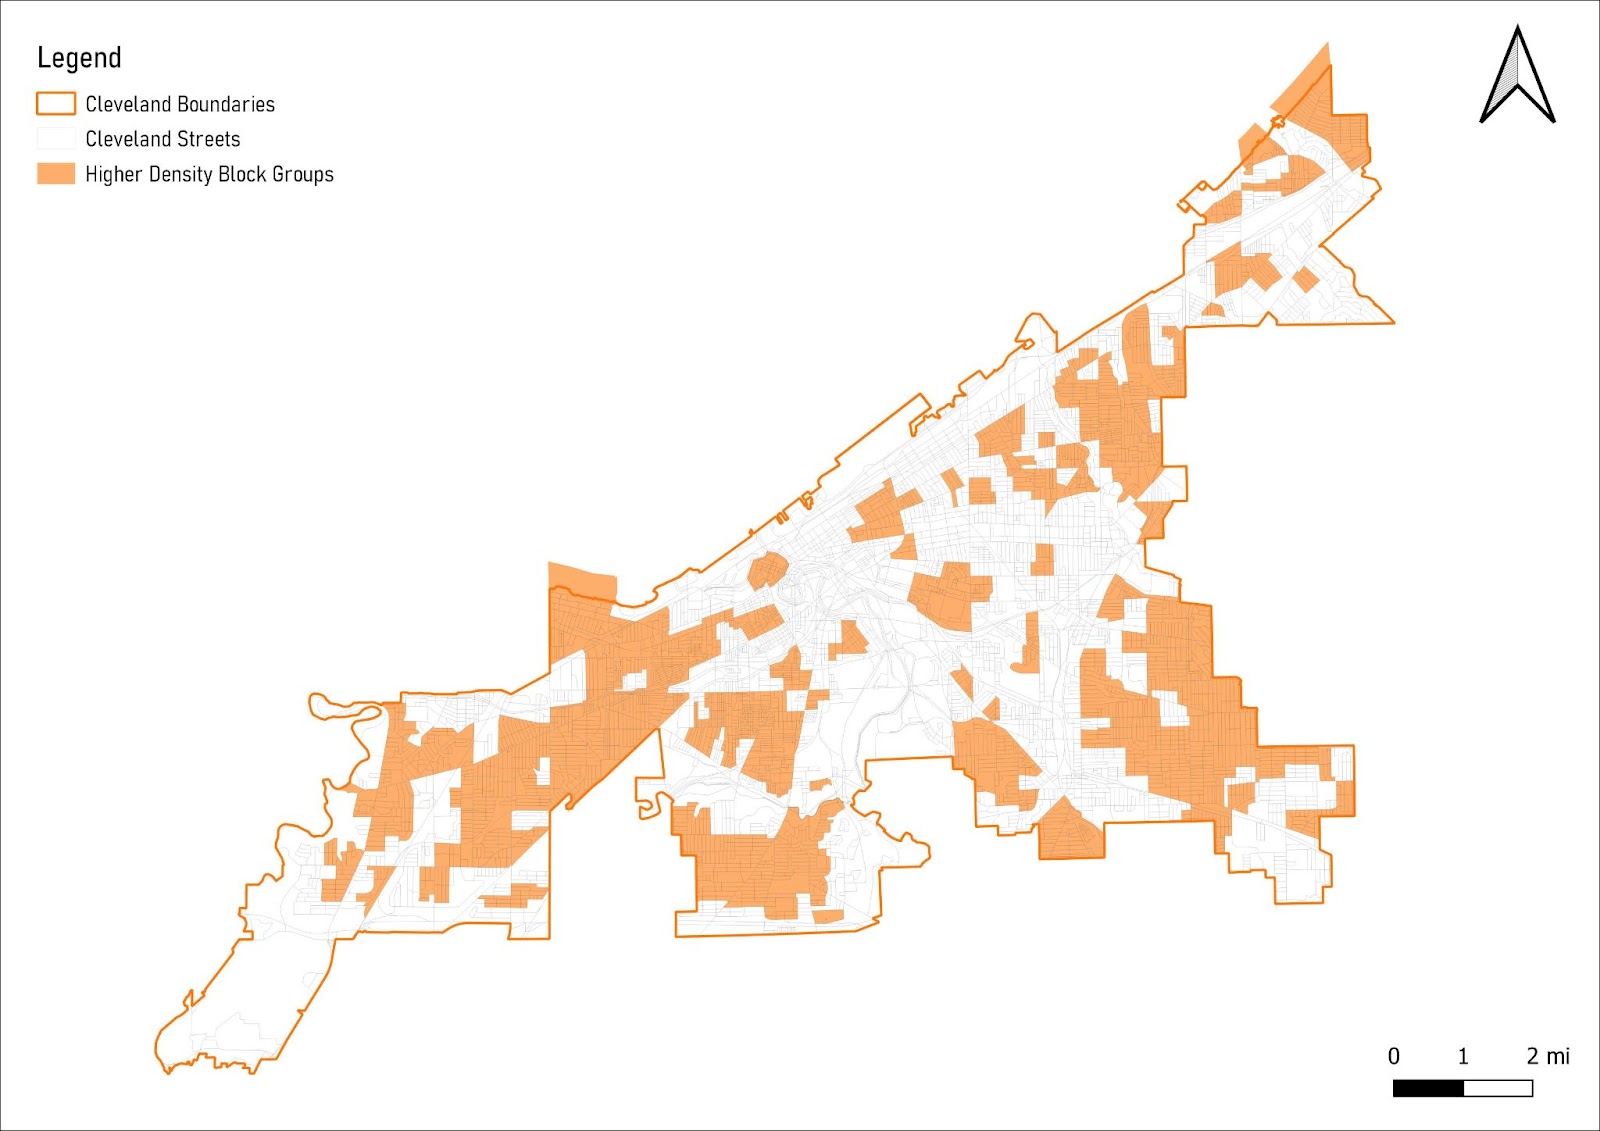
71% of Cleveland’s population lives in these 29 sq miles highlighted in orange, which represents only 38% of the city’s total land area. Source: US EPA
On the other hand, these statistics also allude to a glaring problem: large swaths of the city are either sparsely populated or contain no population at all. It is alarming that most of the areas closest to Downtown have a relatively low population density. This is not good because it creates dead zones with very limited urban activity. For example, we can see from the map above that there is a very low population density in Midtown, where most of the land in the neighborhood is dedicated to office use. As a result, despite being located along such a great transit service as the HealthLine, there is extremely limited pedestrian activity throughout the day. However, Midtown is not the only part of Cleveland that is located along quality transit and has very little population.
Conclusion
Overall, it is apparent from this research on the topic that the City of Cleveland is in need of a greater population density, at least in some sections of the city. In particular, it would be very wise to prioritize new residential developments that are located along the city’s main transit corridors, so as to incentivize the use of sustainable transportation modes.
Thank you for reading!
Comments
Post a Comment